Data is often misunderstood. It's more than just big numbers and math problems, it's a story told through feedback. But what is data anyways? If you think about it, it's really just a way to aggregate feedback.
One way to get data is through design surveys. While gathering data is necessary, we say it's okay to forget about the math (sometimes) and let your numbers tell you a story instead. Your design and your numbers alone aren't going to sell your work, but instead it's how you tell their story. Design surveys allow us to both collect feedback at scale and construct those stories.
Improve Your Design by Surveying Your Work
If you walk around a theme park or a mall, chances are someone holding a clipboard is going to stop you and ask you a couple questions. These questions will undoubtedly range from asking how your trip to the park is to asking how many sodas you purchased throughout the day for your family.
These questions, among others, let the surveyor tell a story about the park's guests. This lets them decide where to focus improvements with their guests' satisfaction in mind. It's not about how many sodas were sold, but who was purchasing them.
Surveying your design concepts can also provide extremely valuable information. They are a great way to see what people like, what they'll remember or even if they can click on your intended button for a specific interaction.
Ask Questions — It's the First Hurdle
We can use design surveys on wireframes to help us choose which ideas we may want to explore before putting tons of time into visual design or coding. By surveying a network of user tests, you can collect data to help make your decision decisions.
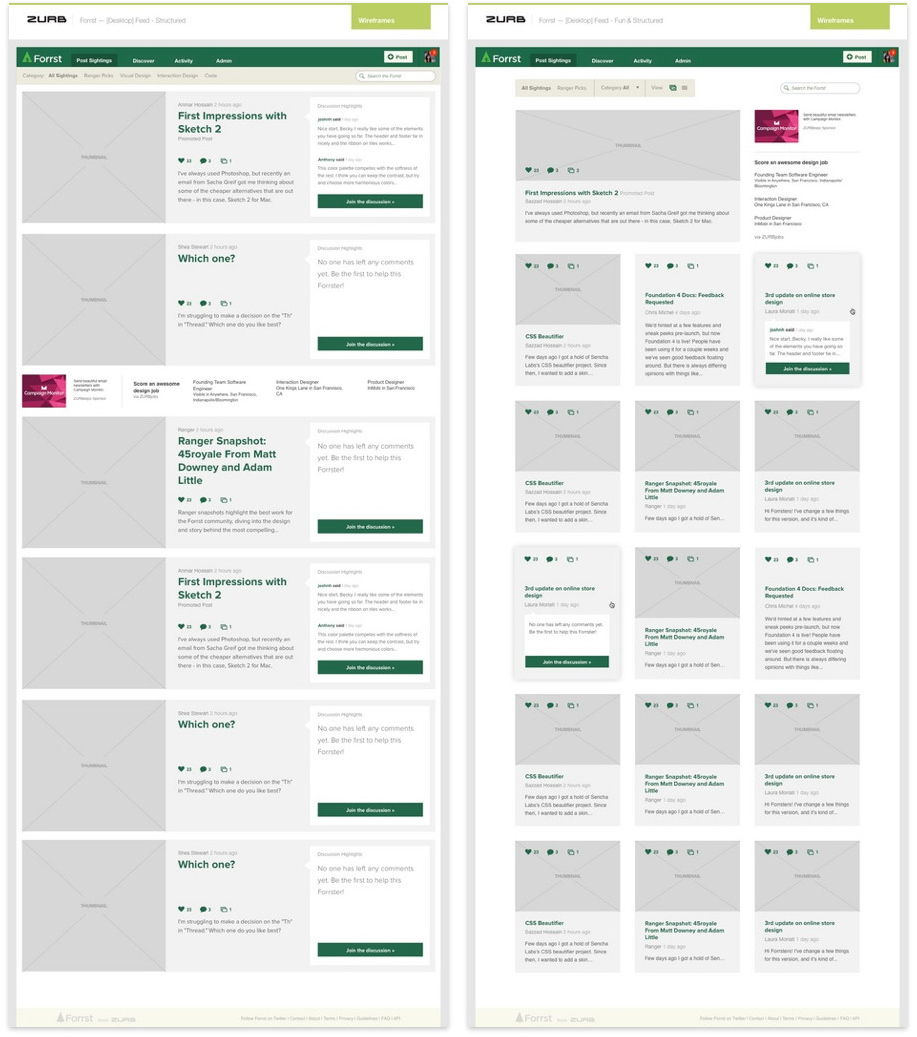
Just as we have done with our designer and developer community, Forrst, which we acquired earlier this year. It has gone through a couple iterations and we have big plans for the future. In this case, we presented our network of testers with two options for a potential Forrst redesign. One option was a single-column layout for the site's stream of post, the other, a three-column grid.
 Click on the image to see the full report in Verify
Out of 100 responses, survey says that people would be more interested in a site with three-columns with viewing on their desktop browser. But unlike, Family Feud's famed 100 response surveys, we also received some qualitative data to help us make an informed decision. More on that in the coming weeks.
Survey Interactions to Learn About User Behavior
Surveying interactions will help you understand how people interact with your product. People will often answer a question differently from how they would actually perform an action. This is because people, whether there is a right or wrong answer, wish to be correct. They will tell you what they think you want to hear.
Instead, ask people to complete an action as we did with Fandango's homepage while showing them an image of the page:
Imagine you and a couple friends want to see a movie tonight but aren't sure which one. Click on the search method you'd use to help pick this evening's movie selection.
Let users show us what they would do instead of talking or asking survey questions with hypothetical actions. What you learn may surprise you.
 Click on the image to see the full report in Verify
Numbers are Great, But...
Most of us are not numbers people. So what is a good number of participants to have? Theories range from participates as low as five to what seems to be an infinite number of results. While numbers will provide extra meaning to your feedback, don't get too hung up on math or statistics. Instead let the numbers help tell you a story.
